Crop Diversity and Nutrition in West Java
Gerald G. Marten and Oekan S. Abdoellah
Ecology of Food and Nutrition Vol. 21, pp. 17-43 (1988)
For readability, some figures images may best be viewed via .pdf - Download .pdf (2.2mb)
Small-scale, subsistence agriculture in Java has an exceptional diversity of interplanted crops - a diversity that is declining as farm sizes decrease due to population growth and greater emphasis is placed on the most profitable crops for an expanding market economy. The nutritional consequences of these changes can be examined by examining interrelationships between household economic status, market involvement, dietary preferences, crops employed, crop yields and food consumption.
The large quantity of rice in the Javanese diet frequently leads to deficiencies in the production and consumption of calcium, iron, riboflavin and vitamin A. Mixed-cropping fields and homegardens are the major source of these critical vitamins and minerals. The production of these vitamins and minerals is greater in fields and gardens with a greater diversity of interplanted crops.
Some Javanese families do not have sufficient land to produce all the food they need. In addition to the vitamins and minerals mentioned above, calories and methionine are in particularly short supply for these families. Data obtained indicated that a mix of starchy root crops, legumes and green leafy vegetables can satisfy nutritional needs with the least amount of land. This is the cropping strategy generally followed by families with insufficient land, but they could improve their nutrition by placing greater emphasis on specific green leafy vegetables that produce larger quantities of critical vitamins and minerals.
An increase in the market economy itself does not appear to have undesirable nutritional consequences, since families are not losing critical nutrients in the process of selling their produce and buying other foods for home consumption.
Key Words: nutrition, tropical agriculture, Java, mixed cropping, agroecosystem, crop diversity
Introduction
Small-scale agriculture in the tropics is changing rapidly because of increasing population pressure on the land, the introduction of new agricultural technologies from abroad, new opportunities for agricultural markets and an increasing need for cash earnings to purchase more consumer goods. The prevailing trend is from traditional, subsistence agriculture, based on a diversity of crops for meeting a diversity of household needs, to a market-oriented agriculture based on fewer crops to take advantage of market opportunities. What are the nutritional consequences of these changes? How can the existing agriculture be modified to improve nutrition? The answers to these questions can help agricultural scientists to design better cropping systems for small-scale farm households.
The Institute of Ecology at Padjadjaran University, Bandung, Indonesia, has surveyed the unusually diverse mixed-cropping agriculture in the uplands of West Java (Figure 1), where population density is high, individual landholdings are small and food production is intensive. Most village households in the area grow most of their own food and sell excess production on the local market. Abdoellah (1982) has described the methods and procedures of the survey in detail.
Figure 1. Location of the study area in Jatigede, West Java.
This paper presents results from the survey which addresses the nutritional role of crop diversity at two levels:
- the several different cropping systems that most households employ on different parcels of land at their disposal;
- the mixture of interplanted crops in each cropping system.
Although broad results of the study should apply generally to most upland areas in West Java, details in the figures and tables apply only to the survey area of approximately 100 km2.
Of primary concern are relationships between the mix of crops employed by a farm household at these two levels and the quantities of various nutrients produced by the mix. In addition to calculating the nutrient production of each cropping system, consideration is given to the impacts of social factors such as population density, economic status, dietary habits and market opportunities on farmer cropping decisions and, ultimately, the production and consumption of various nutrients (Figure 2).
The paper is organized around the following process:
- identifying critical nutrients (nutrients whose consumption falls below accepted nutritional standards);
- describing the nutritional role of three major cropping systems in West Java;
- identifying the impact of social factors such as household economic status and market involvement upon critical nutrient production and consumption;
- using optimization to provide insights on crop mixes that can best meet nutritional needs;
- suggesting modifications to existing cropping systems that can improve the supply of critical nutrients.
Figure 2. Interacting factors that influence the nutrient consumption of small-scale farming households.
On the one hand, this process addresses interactions between agriculture and its social setting; on the other hand, it addresses relationships between cropping strategies and the extent to which they meet human needs. This format has much in common with analytic frameworks represented by farming systems, human ecology and agroecosystems (Hart, 1980; Conway, 1985; Gibbs, 1985; Rambo and Sajise, 1985; Marten and Saltman, 19861) though this paper is not particularly tied to any of those frameworks.
Nutrient Production and Consumption - Identification of Critical Nutrients
Figures 3 and 4 show the average production and consumption of calories, protein, vitamins, minerals and amino acids, estimated from household records and interviews on the production and consumption of different kinds of foods. Food production and consumption data were converted to nutrient values and expressed as a ratio to recommended intakes with the assistance of tables by the Directorat Gizi Departemen Kesahatan (1967), FAO (1970) and U.S. Dept. Health and FAO (1972). Figures 3 and 4 show that everyone produces and consumes thiamine, niacin, vitamin C and most amino acids in more than adequate amounts; but there is a general deficiency in the consumption of iron, calcium and riboflavin - a consequence of consuming so much rice, which is low in iron, calcium and riboflavin. Rice is completely lacking in vitamins A and C, but vitamin C is provided in ample quantities from homegarden fruits.
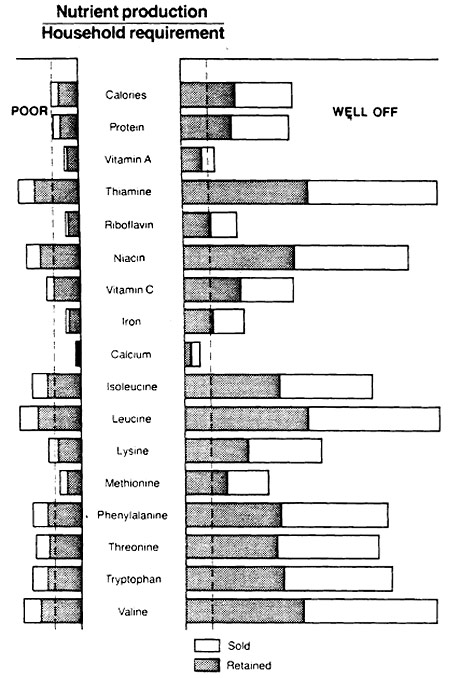
Figure 3. Average annual nutrient production by poor and well-off West Java households expressed as a proportion of recommended nutrient intakes listed in Table 7 (represented by the dashed line).
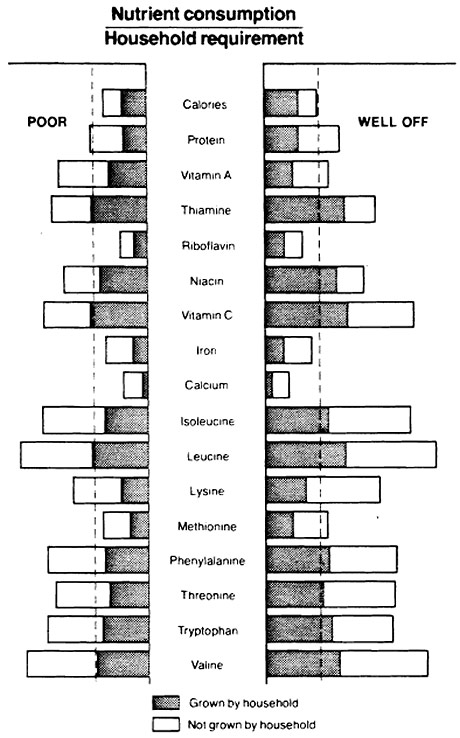
Figure 4. Average nutrient consumption of poor and well-off West Java households during January-March. The dashed line represents recommended nutrient intakes listed in Table 7. Food not grown by the household is obtained primarily through purchases.
The poor are subject to additional deficiencies because they lack the land to produce the quantity of food they need. In this study the poor are defined as the 25% of village households whose income from all sources - including off-farm income, sale of farm produce and the value of crops retained for home consumption - is less than US$100 per year. The poor average only 0-3 hectares of land per household, one quarter the area farmed by well-off village households; and many of the poor have no ricefields at all, particularly the poor nearer to market towns where population density is higher and there is less land per household (Table I). As a consequence, the poor produce much less food than well-off villagers - not enough vitamin A, riboflavin, iron, calcium and methionine to meet their needs (Figure 3). The poor consume nearly all nutrients in somewhat smaller quantities than the well-off (Figure 4). Consumption of calories and methionine by the poor is less than adequate, and total protein consumption is barely adequate on average.
Table 1. Landholdings, crop diversity, and income characteristics of West Java households
|
Poor c |
Well-off c |
||
|
Nearmarket d |
Far from market d |
Near market d |
Far from market d |
Percentage of households |
97 |
100 |
99 |
97 |
Percentage of households |
57 |
89 |
82 |
97 |
Percentage of households |
73 |
100 |
91 |
97 |
Average size of |
223 |
297 |
417 |
394 |
Average size of |
1120 |
2604 |
3995 |
7174 |
Average size of |
2050 |
2426 |
6853 |
5240 |
Total area farmed (m2 ) |
2254 |
5037 |
9962 |
12366 |
Average number of |
14.3 |
20.4 |
20.0 |
21.9 |
Average number of |
4.1 |
10.8 |
10.7 |
11.4 |
Average annual cost
of |
48 |
78 |
156 |
223 |
Average annual gross farm |
114 |
143 |
654 |
508 |
Average annual off-farm |
108 |
103 |
550 |
236 |
Average family size |
4.6 |
4.8 |
4.9 |
3.9 |
a - Average based only upon households having that agricultural system.
b - One U.S. dollar = approximately 670 rupiah.
c - Defined in text.
d - Near market is less than 5 km from a market town; far from market is more than 5 km.
Animal products make a significant contribution to protein intake, particularly for well-off households (Table 2). The lower consumption of animal products by poor households is particularly conspicuous in the case of poultry and meat (the poor consuming virtually no meat). Fish provide a significant quantity of calcium for the poor in the form of small bones. Households within 5 km of a market town consume somewhat more animal products than those far from a market. The difference is due to poultry and meat (those far from a market consuming very little meat); households far from market consume slightly more fish than those near market.
Table 2. Nutrients consumed by West Javanese families through animal products (expressed as a percentage of household nutrient requirement)
|
Poor |
Well off |
||||||
|
Fish |
Meat |
Poultry |
Total |
Fish |
Meat |
Poultry |
Total |
Energy |
2 |
0 |
1 |
3 |
3 |
1 |
3 |
7 |
Protein |
16 |
0 |
3 |
19 |
25 |
4 |
10 |
39 |
Vitamin A |
1 |
0 |
2 |
3 |
1 |
13 |
8 |
22 |
Thiamine |
2 |
0 |
1 |
3 |
3 |
1 |
4 |
8 |
Riboflavin |
4 |
0 |
2 |
6 |
6 |
3 |
8 |
17 |
Niacin |
11 |
0 |
2 |
13 |
9 |
3 |
8 |
20 |
Vitamin C |
0 |
0 |
0 |
0 |
0 |
1 |
0 |
1 |
Calcium |
15 |
0 |
1 |
16 |
7 |
0 |
2 |
9 |
Iron |
5 |
0 |
2 |
7 |
7 |
3 |
5 |
15 |
Isoleucine |
26 |
0 |
7 |
33 |
48 |
7 |
28 |
83 |
Leucine |
28 |
0 |
7 |
35 |
52 |
8 |
25 |
85 |
Lysine |
31 |
0 |
6 |
37 |
56 |
7 |
24 |
87 |
Methionine |
14 |
0 |
6 |
20 |
26 |
3 |
17 |
46 |
Phenylalanine |
18 |
0 |
5 |
23 |
34 |
5 |
16 |
55 |
Threonine |
26 |
0 |
5 |
31 |
48 |
6 |
20 |
74 |
Tryptophan |
9 |
0 |
4 |
13 |
11 |
8 |
18 |
37 |
Valine |
31 |
0 |
7 |
38 |
55 |
7 |
24 |
86 |
Nutritional Roles of the Cropping Systems
Major Cropping Systems
Most food production in West Java occurs in three broad cropping systems: ricefields, homegardens and upland fields. Most village households employ all three of the cropping systems (Table I) because the three cropping systems complement one another in satisfying nutritional and other household needs.
Ricefields occupy bottom land, most of which is irrigated. Irrigated ricefields are generally planted continuously to rice, five crops every two years. There are also ricefields in upland areas that depend on rainfall. Rainfed ricefields can be planted only once each year and are planted to tobacco, beans or vegetables after the rice. Although ricefields are dominated by wet rice, they may also contain other crops (for example, beans) along the edges of the paddies.
Homegardens occupy the land around houses, typically located in villages on slightly elevated land at the edge of rice paddy areas. Most homegardens contain an impressive diversity of trees, field crops, medicinal plants and ornamentals (Table 3). Some consist primarily of field crops, while others have a dense planting of trees that makes them appear almost like a forest. The diversity of homegarden crops provides a continual harvest to meet a variety of household needs throughout the year.
Upland fields are away from houses, generally on higher ground, and consist primarily of field crops such as upland rice, corn, beans, sweet potatoes, peanuts, cassava or vegetables; bananas or trees may be scattered through the fields. Upland fields generally have fewer crops species than homegardens, varying from simple monocultures to systematically-planted mixtures of ten or twenty different crops. Upland fields and homegardens have been described in detail by Christanty et al. (1986).
Table 3. Common food crops and spices of West Javanese families (listed in order of frequency of occurrence)
Common in homegardens and upland fields |
||
English name |
Local name |
Latin name |
Banana |
Pisang |
Musa paradisiaca |
Cassava |
Singkong |
Manihot utilissima |
Mango |
Mangga |
Mangifera indica |
Chili pepper |
Cabe |
Capsicum annum |
Coconut palm |
Kelapa |
Cocos nucifera |
Turmeric |
Koneng |
Curcuma domestica |
Jack fruit |
Nangka |
Artocarpus integra |
Yam |
Ubi manus |
Dioscorea alata |
Locus bean |
Pete |
Parkia speciosa |
Onion |
Bawang daun |
Allium fistulosum |
Eggplant |
Terong |
Solanum melongena |
Sapodilla |
Sawo |
Achras zapota |
Ginger |
Jahe |
Zingiber officinale |
More common in homegardens |
||
English name |
Local name |
Latin name |
Soursop |
Nangka belanda |
Annona muricata |
Taro |
Keladi |
Colocasia esculenta |
Cashew nut |
Jambu monyet |
Anacardium occidentale |
Rose apple |
Jambu air |
Eugenia aquea |
False panax |
Mangkokan |
Nothopanax scutellarium |
Papaya |
Pepaya |
Carica papaya |
Clove tree |
Cengkeh |
Eugenia aromatica |
Pineapple |
Nenas |
Ananas comosus |
Leucaena |
Lamtoro |
Leucaena glauca |
Pomelo |
Jeruk bali |
Citrus maxima |
Elephant yam |
Suweg |
Amorphophallus campanulatus |
Star fruit |
Blimbing |
Averrhoa carambola |
Rambutan |
Rambutan |
Nephelium lappaceum |
Tangerine |
Jeruk manis |
Citrus aurantium |
Tomato |
Tomat |
Solanum lycopersicum |
Arrowroot |
Sagu patat |
Maranta arundinacea |
Hedge panax |
Kedongdong pagar |
Polyscias fruticosa |
Sweet shoot |
Katuk |
Sauropus androgynus |
More common in upland fields |
||
English name |
Local name |
Latin name |
Sweet potato |
Ketala rambat |
Ipomea batatas |
Bamboo |
Bambu apus |
Gigantochloa apus |
Maize, corn |
Jagung |
Zea mays |
Upland rice |
Padi |
Oryza sativa |
Peanut |
Kacang tanah |
Arachis hypogaea |
Spinach |
Bayam |
Amaranthus hybridus |
Species Composition of Cropping Systems
It is well known that·interplanted crop mixtures can provide higher and more reliable yields than any single species in monoculture - provided the right mixture is employed (Kass, 1978; Willey, 1979; Gomez and Gomez, 1983). The crop mixtures in Java appear to be ones that have proved best over centuries of trial and error, but no particular mixtures prevail because each household tailors its crop production to meet its individual needs. One hundred and fifty households in the survey had a combined total of 120 food crops (including spices) and 142 medicinal plants, ornamentals and trees. With so many crop species to choose from, there is enormous variation in the homegardens and upland fields from one household to another, and the production of different nutrients varies accordingly.
Characterizing the mix of crops in a field or garden is complex because there are so many crop combinations, but the fact that certain crops tend to occur together in groups (or constellations) provides an opportunity for simplification. A number of constellations have been identified by applying factor analysis to tables specifying which crop species are present or absent in the homegardens and upland fields of different households. The constellations can be regarded as multi-crop modules within the larger agricultural system, major building blocks for agroecosystem structure. Above all, the constellations consist of crops that are ecologically compatible; the crops flourish under the same ecological conditions but do not crowd one another out. The particular constellations employed by a particular household depend in part upon needs associated with the household’s socioeconomic status and in part upon personal preferences.
Most homegardens contain two or three constellations along with a miscellany of other plant species. Just as each crop species has a unique nutrient profile (the quantities of different kinds of nutrients it produces per unit area of land), a constellation also has a nutrient profile that can be estimated by summing the nutrient profiles of its component crops, weighted according to their areal representation in the constellation.
The following are examples of common homegarden constellations (Figure 5):
- Yam (Dioscorea alala), taro, arrowroot, and ganyong are starchy crops that make this constellation high in the production of calories and protein but low in vitamins and minerals (except iron).
- Soursop, mango and jackfruit are fruit trees that are common because they are disease resistant and provide year-round income by fruiting at different times of the year. The production of this constellation is high in vitamin C but low in other nutrients.
- Cassava, chili, papaya and basil - as well as chili, eggplant, spinach and ginger - produce moderate quantities of calories and protein and large quantities of vitamins and minerals.
- Coconut, soursop, pomelo and locus bean produce moderate amounts of all nutrients except vitamin A. This is the only constellation that produces significant amounts of methionine.
- False panax, hedge panax and sweet shoot are three vegetables that are customarily cooked together. This constellation produces virtually no calories or protein but moderate amounts of most vitamins and minerals and large amounts of vitamin A.
Figure 5 continued
Figure 5. Annual nutrient production from West Java homegarden constellations. Huimanis = yam (Dioscorea alata), languas = galangal (Languas galanga), mahoni = mahogany (Swietenia mahogani). Puring (Codiaeum variegatum), impatient (Impatiens balsamina) and suji (Pleomelle elliptica) are ornamentals and cikur (Kaempferia galanga) is a medicinal plant. English, local, and Latin names of other crops are listed in Table 3.
The following are common upland-field constellations (Figure 6):
- Ginger, turmeric and galangal are spices that prefer wet soil and thrive in the shade under jackfruit trees. Nutrient production is low, except for vitamin A, vitamin C and iron.
- Locus bean, jengkol (Pithecellobium lobatum) and sapodilla tolerate the semi-shade conditions under coconut trees. This constellation produces particularly large quantities of calories, protein and iron.
- Cassava, sweet potatoes, taro and chili peppers produce large quantities of all nutrients except methionine.
- Sweet potatoes, bananas, peanuts, corn and beans are basic foods that grow compatibly together. Bananas are considered to shade the soil and keep it moist for sweet potatoes, but peanuts must not be grown immediately beneath the bananas or they will rot. This constellation produces moderate amounts of all nutrients (except vitamin A, which is produced in large amounts).
Upland-field constellations tend to have a higher and more balanced production of nutrients than homegarden constellations. This is particularly true for the cassava-sweet potato-taro-chili constellation, as well as constellations including legumes.
Figure 6 continued
Figure 6. Annual nutrient production from upland field constellations in West Java. Jengkol (Pithecellobium lobatum) is a medicinal plant. English, local and Latin names of other crops are listed in Table 3.
Comparison of Cropping Systems
Figure 7 shows how the three major cropping systems complement each other in the nutrients they contribute to the average household. Ricefields provide most of the calories, protein, thiamine, niacin, riboflavin and iron, but upland fields and homegardens provide major quantities of vitamin C, vitamin A and calcium. Homegardens make the smallest contributions because of the relatively small amount of land they occupy.
The relative strengths of the cropping systems can be appreciated by comparing their nutrient production profiles (Figure 8). The production of calories, protein and amino acids per square meter is more than five times greater in ricefields (most of which are irrigated year round) than in upland fields and homegardens (which are rainfed). Production of riboflavin, iron and calcium is more equal, while homegardens and upland fields produce substantially more vitamin A and vitamin C per square meter than ricefields.
Cash is an important agricultural product, one that can be used to purchase food, among other things. The value of production per unit area is considerably greater from ricefields and well-off homegardens than from upland fields and poor homegardens (Figure 9). The cash output per square meter of ricefields is more than twice the cash output from the other two agricultural systems, in part because more of the rice is sold for cash. However, the ratio of cash outputs to cash inputs is highest in homegardens because homegarden products have a high value despite relatively low cash inputs.
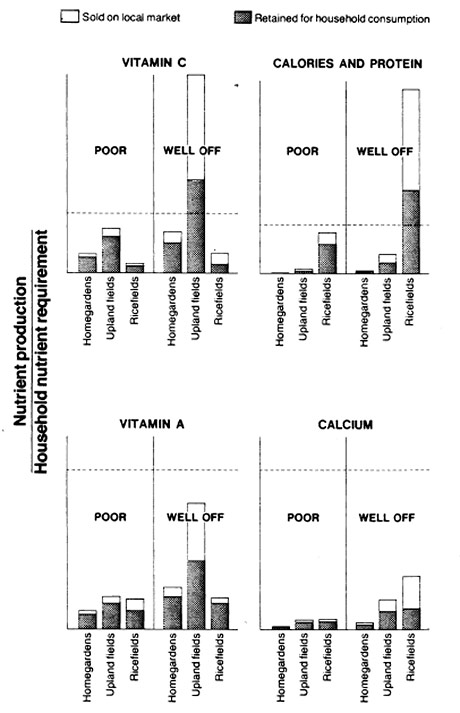
Figure 7 continued
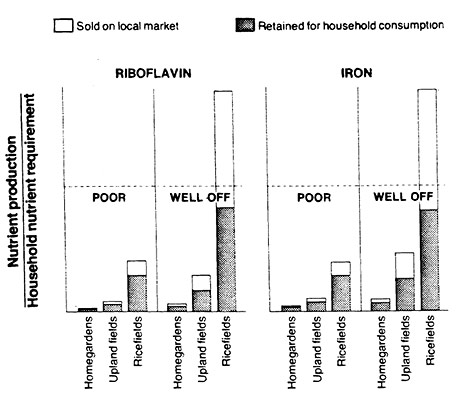
Figure 7. Average contributions of homegardens, upland fields and ricefields to household nutrition in West Java. The dashed line represents recommended nutrient intakes listed in Table 7.
Impact of Social Factors on Nutrient Production and Consumption
Cropping Structure
The structure of a garden or field has five major dimensions that influence the yields of different crop species:
- size of the garden or field;
- crop composition;
- horizontal organization of the crops in space (interplanting pattern);
- vertical organization of the crops in space (vertical stratification);
- organization of the crops in time (crop sequences or rotations).
The decisions of farmers that structure their gardens and fields in each of these dimensions are influenced by a variety of social factors associated with a household’s economic status and market involvement. With multiple regression analysis, it was possible to examine the net impact of these social factors on nutrient production without dealing explicitly with details of the spatial and temporal organization of the numerous crops in these agroecosystems. Table 4 summarizes the partial regression coefficients from a regression analysis using the production of individual nutrients as dependent variables. Variation in the production of different nutrients from household to household, and variation in the household characteristics listed as independent variables in Table 4, provided the statistical basis for the analysis.
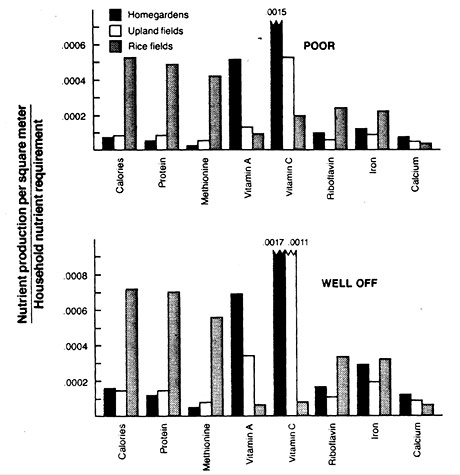
Figure 8. Average annual nutrient production (per unit of land) in the three agricultural systems.
Household Economic Status and Production
The production per unit area from the homegardens of well-off households is approximately twice the production from poor households (Figure 8). There are numerous differences between the social conditions of well-off and poor households and the nature of their landholdings, but three of the most prominent are the size of their homegardens, the diversity of crop species and the quantity of inputs such as commercial fertilizers and pesticides - all of which are greater for well-off households.
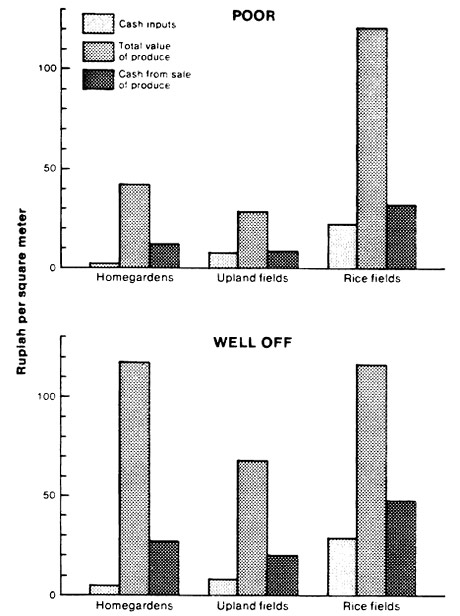
Figure 9. Average annual cash inputs and outputs of the three agricultural systems.
Part of the explanation for higher production by well-off households lies with their cash inputs, which have a significantly positive effect on production per square meter of some of the nutrients, vitamin C being the most conspicuous (Table 4). However, the most significant effect in Table 4 is the positive association of nutrient production with the number of crop species in the garden, reflecting more efficient utilization of space when different crop species are mixed. Particularly significant is the higher production of vitamins and minerals. Crops that are high in vitamins and minerals are well represented when diversity is high but poorly represented when diversity is low.
The larger land holdings of well-off households do not in themselves contribute to higher productivity per unit area. In fact, Table 4 indicates that (other things being equal) nutrient production per square meter tends to be less in the larger gardens, perhaps because of less intensive care. This tendency is particularly pronounced for calcium, iron and riboflavin, suggesting that households with smaller homegardens tend to concentrate their limited space on crops that are high in these critical nutrients.
The pattern for upland fields is similar to that in homegardens. Cash inputs are positively associated with the production of all nutrients (Table 4). The number of crop species in the field is also significant and positive, particularly for vitamins and minerals. Larger fields tend to have a lower production of all nutrients per square meter, though the effect is not so strong.
Table 4. Significant impacts of various factors on nutrient production per square meter (based on partial regression coefficients)a
|
Homegardens |
Upland fields |
||
Independent variables |
Staple nutrients |
Other vitamins |
Staple nutrients |
Other vitamins |
Total area of garden |
- |
- |
- |
- |
Cash inputs |
0 |
+ |
++ |
++ |
Number of |
+ |
++ |
+ |
+ |
Proximity to |
- |
0 |
0 |
0 |
Note: Staple nutrients = calories, protein, niacin, thiamin, iron.
Other vitamins and minerals = vitamin A, vitamin C, riboflavin, calcium.
a++ = highly positive impact (p < 0.01)
+ = positive impact (0.01 < p < 0.1)
0 = no significant impact (p > 0.1)
- = negative impact (0.01 < P < 0.1)
Market Involvement
Proximity to market is associated with lower production of nutrients from homegardens (Table 4), primarily nutrients other than the critical vitamins and minerals (that is, calories, protein, amino acids, thiamine and niacin). This is because homegardens closer to market towns (particularly in well-off households) tend to emphasize high-value cash crops (for example, coffee, cloves and fruits) instead of staple foods. Table 4 indicates that proximity to market is of no consequence to the production of nutrients from upland fields.
The sale of farm produce can reduce the amount of food available for home consumption. Nonetheless, food sales do not necessarily lead to nutritional shortfalls; the surplus food production by well-off households is great enough that they can sell about one half of their food production (primarily from ricefields and upland fields) and still be left with enough food to satisfy most of their nutritional needs (Figure 3). Poor households, which do not produce enough food to meet their needs, sell much less of their food production; however, poor households still must make substantial food purchases, even to meet basic nutritional needs such as calories and protein. .
Households within 5 km of a market town sell a much larger percentage of their rice crop than households that are more distant from market. However, the opposite is true for homegardens and upland fields. Households that are further from a market town tend to have larger homegardens and upland fields with surplus production for sale. Households closer to market towns use their limited amount of land to focus more intensively on producing crops that are high in critical vitamins and minerals for home consumption. The poor near markets sell only 10% of the produce from their homegardens and upland fields. Households near markets purchase a much larger percentage of their staple foods than households far from market; twice as much calories, thiamine and niacin, and 50% more of most other nutrients. The net result of food sales and purchases is that the average quantities of each nutrient consumed by households of the same economic status near market and far from market are virtually identical (Figure 10).
Optimizations for Insights on Crop Mixes and Nutrition
Optimization Framework
Cropping decisions of Javanese households are based on a variety of objectives, but a particularly compelling objective for many households is meeting their nutritional needs with as little land as possible. The question "What mix of crops can meet a household’s nutritional needs with the least amount of land?" can be framed as a formal optimization problem. While others (for example, Shah, 1983) have used food prices to identify "least cost" diets to meet nutritional needs, the concern In this case is for "least land." The optimization is, therefore, based on efficiencies of nutrient production per unit area of land.
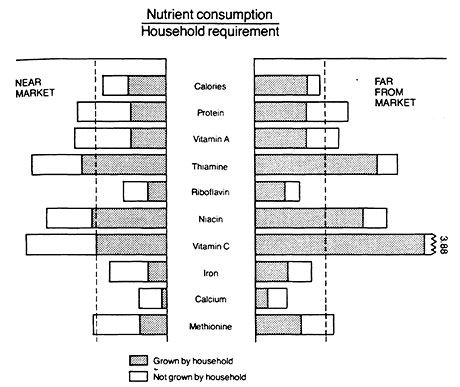
Figure 10. Average annual nutrient consumption by households near and far from market towns. The dashed line represents recommended nutrient intake.
Table 5. Additional crops from West Java gardens that were included in optimizations
English name |
Local name |
Latin name |
Soybean |
Kedele |
Glycine max |
Sweetsop |
Buah nona |
Annona reticulata |
Custard apple |
Sarikaya |
Annona squamosa |
Horse mango |
Limus |
Mangifera foetida |
Avocado |
Apokat |
Persea americana |
|
|
Persea gratissima |
Garlic |
Bawang putih |
Allium sativum |
Cucumber |
Bonteng |
Cucumis sativus |
Squash |
Waluh |
Cucurbita moschata |
|
|
Cucurbita pepo |
Unchoy |
Kangkung |
Ipomoea reptans |
Bitter melon |
Paria |
Momordica charantia |
Horseradish |
Kelor |
Moringa oleifera |
Rice bean |
Kacang uci |
Phaseolus lunatus |
Mung bean |
Kacang hijau |
Phaseolus radiatus |
Wing bean |
Kecipir |
Psophocarpus tetragonolobus |
Black nightshade |
Leunca |
Solanum nigrum |
Tamarind |
Asam |
Tamarindus indica |
If xi is the land area devoted to the i-th crop, optimal xi satisfies the objective
Minimize ∑ixi (1)
subject to the constraints
xi > 0
∑ |
cijxi > Yj |
i |
Yj = household requirement for the j-th nutrient
Cij= production efficiency of the j-th nutrient by the i-th crop.
The optimal crop mix can then be calculated by means of linear programming. If it is desired to calculate the mix of crops that will come closest to meeting nutritional needs when there is not sufficient land to meet those needs, goal programming is more appropriate (Bartlett, Bottoms and Pope, 1976; Ignizio, 1982). The goal programming formulation is:
Minimise |
[ |
∑ |
Abs |
( |
∑ |
cijxi - Yj)] |
| j |
i |
subject to the constraint
∑ixi ≤ b
b = the total amount of land available.
Because different crops in the same garden compete for the same resources, the suitability of each crop can be evaluated best in terms of the efficiency with which that crop produces various nutrients per unit of land resource. The land resource includes not only space but also sunlight, water and minerals. Although no single measure can fully represent the amount of land resource occupied by a plant, the best measures from an ecological point of view appear to be the leaf area of the crop or the actual land area occupied. The coefficients for the production efficiency (cij) of each crop in the optimization equation are the yields of each nutrient (such as calories, protein, etc.) per unit leaf area of the crop or per unit land area. These coefficients can be estimated by converting yield per plant to nutrient production per plant with the assistance of food-composition tables, and then dividing by the leaf area per plant or the land area occupied by a plant.
There are a number of possible refinements which were not included in the optimization analyses that follow. To be more realistic, an optimal crop mix could take into account the different kinds of land a household has at its disposal, the production efficiencies of each crop during each of the different cropping seasons on each of those lands and the possibility of storing produce from one season to another. There could also be constraints on labor inputs during each cropping season or month of the year, as well as the need to maintain a satisfactory level of consumption for every nutrient throughout the year. Because the money from cash crops can be used to purchase food, a comprehensive optimization could also take into account the cash values of all crops, including in the optimization not only crops that can be grown for home consumption, but also the prices and nutrient contents of foods that can be purchased.
Optimal Crop Composition
In order to see what mix of crops could meet nutritional needs with the least amount of land, the production efficiencies for calories, protein, vitamins, minerals and amino acids in the foodcrops listed in Tables 3 and 5 were estimated on the basis of the nutrient contents of the crops and typical annual yields per unit land area under rainfed conditions. Table 6 summarizes the production efficiency estimates, and Table 7 lists household nutrient requirements (Yj) that were assumed for the optimizations.
The amounts of land that should be devoted optimally to each crop were then calculated by means of goal programming in a series of optimizations that used a range of values for the production efficiencies, spanning the range of uncertainties in the estimates. The solution for each optimization was in terms of a specified number of square meters to be planted to each crop (as in Table 8). Because the optimizations were done for rainfed conditions, they were most relevant to households with land for homegardens and upland fields, but the purpose of the optimizations was general insights rather than detailed prescriptions. The appropriate mix of crops for a particular household depends upon numerous household objectives and details concerning the suitability of different crops for different kinds of land, which could not be included in a general study of this nature.
Table 6. Production efficiencies of major West Java crop groups (expressed as the quantity of energy and nutrients they produce per unit area of land)
|
Energy |
Protein |
Vitamin A |
Riboflavin |
Root crops |
Very high |
High |
Medium-high |
High |
Legumes |
Medium-high |
Very high |
Medium-higha |
Highb |
Rice |
High |
High |
Low |
Low |
Corn |
Medium |
Medium |
Low |
Low |
Green leafy vegetables |
Low-medium |
Medium-high |
Very high |
High-very high |
Other vegetables |
Medium |
Medium |
Mediuma |
Medium-high |
Fruit |
Low-medium |
Low |
Low-mediuma |
Low-high |
a - Vitamin A variable (very high in yellow fruits and vegetables but low or absent in some fruits, legumes, and other vegetables).
b - Riboflavin high but vitamin C low or absent in most legumes.
Table 7. Daily household nutritional requirements of West Java families assumed for the optimizationsa
Energy |
43.96 MJ |
Total protein |
184 g |
Vitamin A |
14500 I.U. |
Thiamine |
3.72 mg |
Riboflavin |
4.37 mg |
Niacin |
60.3 mg |
Vitamin C |
123 mg |
Calcium |
2.58 g |
Iron |
46.8 mg |
Isoleucine |
4.87 g |
Leucine |
7.16 g |
Lysine |
8.43 g |
Methionine |
5.23 g |
Phenylalinine |
5.33 g |
Threonine |
4.95 g |
Tryptophan |
1.04g |
Valine |
5.20g |
a These figures are also the basis for the dashed lines representing recommended nutrient intakes in Figures 3, 4, 7 and 10.
The particular crops in an optimal mix (and the precise land areas allocated to each crop) varied with precise values used for production efficiencies. Nonetheless, a consistent pattern emerged from the optimizations as a whole, which could be instructive for least-land food production strategies. The optimal mix always consisted of crops from the following three groups:
- starchy root crops (such as sweet potato, cassava, taro) or functionally similar crops (such as squash);
- legumes (such as beans or peanuts) or other high-protein crops (such as coconuts); and
- green leafy vegetables (such as unchoy or spinach).
Staple grains, fruits, and vegetables other than green leafy vegetables were never allocated land in the optimal mix.
Table 8. The mix of crops which could meet the nutritional needs of an average West Java household with the least amount of land (expressed as square meters of land devoted to each crop)a
|
Cassava |
Wing bean |
Peanuts |
Unchoy |
Spinach |
Total |
No rice or animal |
653 |
186 |
201 |
113 |
- |
1153 |
Rice consumed at |
279 |
106 |
11 |
142 |
- |
538 |
Rice consumed at |
226 |
95 |
- |
139 |
124 |
584 |
Animal products consumed |
686 |
153 |
113 |
113 |
- |
1065 |
Animal products consumed |
694 |
100 |
69 |
100 |
- |
963 |
Rice and animal products |
274 |
55 |
- |
175 |
183 |
687 |
Rice and animal products |
190 |
- |
- |
73 |
- |
263 |
a The figures in this table are from an actual series of optimizations. They are for illustrative purposes only. There is no intention to suggest that actual farm households should cultivate these particular crops in the quantities indicated above.
When interpreting these results, it is useful to keep in mind how the major food groups differ in their nutrient production (Table 6). Root crops tend to have high production efficiencies for most nutrients because root crops have a full leaf cover through most of the year. The root crops, therefore, produce continuously throughout the year, and because they channel a large percentage of their biomass production to storage in the roots, yields are high. Fruits tend to have low production efficiencies because fruits are a small percentage of fruit tree biomass production, and fruit yields are, therefore, generally low per unit area of land. Other crops (such as most grains, legumes, and vegetables), with intermediate yields per unit area, have production efficiencies that reflect their nutrient contents. Legumes are in the optimal mix because of their high protein production, and green leafy vegetables are in the optimal mix because of their high production of critical vitamins and minerals.
Some nutrients are easier to provide than others when adjusting a mix of crops to meet nutritional needs. If a household does not have sufficient land to satisfy all its nutritional needs, it can still produce sufficient quantities of calcium, iron and vitamins A and C if it emphasizes crops that are exceptionally effective for producing those nutrients. However, because no crops are exceptionally productive for protein, methionine or riboflavin, it is much more difficult for a household with insufficient land to produce sufficient quantities of these nutrients.
Significance of Dietary Preferences
Dietary tastes are particularly important for a family’s decisions on the mix of crops it will employ. Rice is the preferred staple food crop in West Java, while starchy root crops are considered inferior even though they are highly productive per unit area of land (Table 6). It is, therefore, instructive to examine the mix of crops that can fill the gap to satisfy nutritional requirements with the least amount of land when rice has a fixed place in the diet. (This can be viewed as an optimization problem for homegardens and upland fields when families consume a given quantity of rice from their ricefields or rice purchases.) Taking the example in Table 8 - where the optimal mix without rice is cassava, wing beans, peanuts and unchoy - the amounts of cassava, peanuts and wing beans are substantially reduced when rice is forced into the mix, because rice provides many of the same nutrients provided by cassava, peanuts and beans. However, the optimal quantity of green leafy vegetables is increased because rice is deficient in nutrients provided by these crops. This effect is particularly pronounced for well-off households because they consume more rice.
Animal products provide a significant quantity of the protein and amino acids for most households, particularly well-off households. We can ask whether the optimal mix of crops is different when consumption of animal products is taken into account. This was tested by repeating the optimizations and forcing fish, meat and poultry products into the solution at existing levels of consumption. Table 8 shows that the basic mix of crops remains unchanged, but there is a significant reduction in the amounts of high protein crops (wing beans and peanuts) because animal products provide so much protein. The effect is more pronounced in well-off households because they consume more animal products.
When it is assumed that both rice and animal products are consumed at present levels, so the optimal crop mix only needs to make up the difference between nutritional requirements and nutrients provided by the rice and animal products, the optimal mix still consists of similar crops to those in the optimal mix with no dietary constraints; but details depend upon whether consumption of rice and animal products is at the level of poor or well-off households (Table 8). The need for cassava and legumes is significantly reduced when rice and animal products are included at present levels of consumption by the poor, but the production of green leafy vegetables must be greatly expanded. In the case of well-off households, the need for cassava is reduced when rice and animal products are included at their present level of consumption; legume crops become unnecessary; and green-leafy vegetables are also reduced significantly. The amount of land devoted to crops for filling the nutritional gap of well-off households (assuming consumption of rice and animal products) is only 263 m2, but the total amount of land (the 3358 m2 in Table 9, which also includes the amount of land estimated to be used for the production of rice and generation of income to purchase animal products) is much larger than the 1153 m2 of land necessary to meet household requirements in the case of no dietary constraints in Table 8.
Conclusions Regarding the Improvement of Existing Cropping Systems
While this paper does not presume to suggest solutions to Javanese nutritional problems, there do seem to be some useful insights. The most widespread nutritional deficiencies (calcium, iron, riboflavin and possibly vitamin A) are a consequence of a heavily rice-based diet. Some families do not produce enough calories because they lack sufficient land to do so.
Table 9. The amount of land required to meet household nutritional needs of West Java families when rice and animal products are consumed at present levels and the nutritional gap is filled with an optimal (least amount of land) mix of cropsa
|
Poor |
Well off |
||
Rice |
|
|
|
|
Consumption |
545 kg/yr |
|
618 kg/yr |
|
Land required |
|
1362 m2 |
|
1545 m2 |
Animal products |
|
|
|
|
Consumption |
57 kg/yr |
|
130 kg/yr |
|
Value |
Rp 69000 |
|
Rp 198000 |
|
Land required to produce |
|
575 m2 |
|
1650 m2 |
Land required for optimal |
|
687 m2 |
|
263 m2 |
Total land required |
|
2624 m2 |
|
3358 m2 |
a Based on Table 8.
Ricefields are particularly important for calorie and protein production. Upland fields can also produce substantial quantities of calories and protein. However, the calorie and protein production of upland fields is not easily increased by modifying their crop mix because people with a calorie/protein problem are usually emphasizing already the most efficient crops available and doing so on every bit of land at their disposal. Starchy root crops (sweet potatoes, cassava and taro, for example) are particularly effective for producing calories. The young leaves of these crops also provide protein, vitamins and minerals. The potential of homegardens for calorie and protein production is limited because of their relatively small size.
The most promising possibilities for nutritional improvement lie in augmenting the already significant contributions of critical vitamins and minerals from homegardens and upland fields. Crop diversity appears to be the key, since diversity per se contributes significantly to the production of these critical vitamins and minerals (Table 4), particularly when that diversity includes green leafy vegetables. Improvement may be possible by adding crops that are particularly high in critical vitamins or minerals, while exercising care that antinutrients do not nullify the high vitamin or mineral content of a crop (such as oxalate, which fixes calcium and iron in green leafy vegetables).
Different styles of homegardens will undoubtedly continue to be appropriate for families with different circumstances. Javanese homegardens are intricate agricultural systems that are highly adapted to providing a variety of human needs on a small area of land with relatively low inputs of cash and labor. Most Javanese homegardens are dominated by fruit trees and other perennials, despite the fact that annual field crops are generally a more efficient way to use the land from a nutritional point of view. However, it does not appear wise to alter the role of trees for nutritional reasons alone. Trees perform numerous important functions besides nutrient production (shade, production of fuelwood, production of construction materials etc.) and undoubtedly will continue to occupy a prominent position in most homegardens.
In general, it appears that the combination of subsistence and cash economies in the area covered by this study is nutritionally beneficial and should be encouraged. While families use food purchases to supplement or complement their own food production, the variety of foods in home production provides a solid foundation for a balanced diet. Nutritional problems are less severe than in nearby plantation areas where people buy nearly all of their food.2
Acknowledgements
The field survey in this study was conducted by the Institute of Ecology, Padjadjaran University, and funded through a contract with the Jatigede Hydroelectric Power Project. Otto Soemarwoto provided guidance during design and implementation of the field survey. The members of the field team were Oekan Abdoellah, A. Baihaiki, Carolina, Hadyana, Dayat Hermanto, Johan Iskandar, Henky Isnawan, Maman, Erry Noviar, Megantara, Rachmawati Rachman, B. Sudarma and M. Toufiq. Daniel Saltman contributed to data analyses.
Notes
- Marten, G.G. Measurement problems in agroecosystem analysis: a critique of system properties. In K. Rerkasem and A.T Rambo (Eds), Proc. Third SUAN/EAPI Regional Research Symposium. Multiple Cropping Centre, Chiangmai University, Chiangmai, Thailand. In press.
- Husaini, M.A., R. Suhardjo, E. Megawangi, D. Nurhadi, S. Supardi, Djojosoebagio and D. Karyadi. Diet, nutritional status, and need for potential homegardens in tea plantations. Proc. First International Workshop on Tropical Homegardens, Bandung, Indonesia, December 2-9, 1985. United Nations University, Tokyo, Japan. In press.
References
- Abdoellah, O.S. (1982). Food ecology in the Jatigede future inundated area, West Java. In Environmental Impact Assessment of the Jatigede Dam Project. Institute of Ecology, Padjadjaran University, Bandung, Indonesia.
- Bartlett, E.T., K.E. Bottoms and R.P. Pope (1976). GOAL-Multiple Objective Programming. Range Science Series No. 211, Colorado State University, Fort Collins, Colorado.
- Christanty, L., O.S. Abdoellah, G.G. Marten and. J. Iskandar (1986). Traditional agroforestry in West Java: the pekarangen (homegarden) and kebun-talun (annual-perennial rotation) cropping systems. In G.G. Marten (Ed.), Traditional Agriculture in Southeast Asia: A Human Ecology Perspective. Westview Press, Boulder, Colorado. pp. 132-158.
- Conway, G. (1985). Agroecosystem analysis. Agric. Adm. 20, 31-55.
- Directorat Gizi Departemen Kesehatan (1967). Daftar Komposisi Bahan Makanan. Penerbit Bharata, Jakarta, Indonesia.
- FAO (1970). Amino Acid Content of Foods and Biological Data on Proteins. FAO Nutritional Studies No. 24, Rome. 285 pp.
- Gibbs. C.J.N. (1985). Agricultural systems research in Asia: a comparative discussion of human ecology, agroecosystems research, farming systems research, and cropping systems research. In P.E. Sajise and A.T. Rambo (Eds.), Agroecosystem Research in Rural Resource Management and Development. University of the Philippines, Los Banos. pp. 77-93.
- Gomez, A.A. and K.A. Gomez (1983). Multiple Cropping in the Humid Tropics of Asia. International Development Research Center, Report No. IDRC-176E, Ottawa, Canada.
- Hart, R.D. (1980). Agroecosistemas: Conceptos Basicos. Centro Agronomico Tropical de Investigacion y Ensenanza, Turrialba, Costa Rica.
- Ignizio, J.P. (1982). Linear Programming in Single and Multiple-objective Systems. Prentice Hall, New York.
- Kass, C.L. (1978). Polyculture Cropping Systems: Review and Analysis. Cornell International Agricultural Bulletin No. 32, Ithaca, New York.
- Marten, G.G. and D.M. Saltman (1986). The human ecology perspective. In G.G. Marten (Ed.), Traditional Agriculture in Southeast Asia: A Human Ecology Perspective. Westview Press, Boulder, Colorado. pp. 20-53.
- Rambo, A.T. and P.E. Sajise (Eds.) (1985). An Introduction to Human Ecology Research on Agricu1tural Systems in Southeast Asia. University of the Philippines, Los Banos, Philippines. "
- Shah, C.H. (1983). Food preference, poverty, and the nutrition gap. Econ. Dev. Cult. Change 32, 121-148.
- U.S. Dept. of Health and FAO (1972). Food Composition Table for Use in East Asia. U.S. Govt Printing Office, Washington, D.C. 334 pp.
- Willey, R.W. (1979). Intercropping—its importance and research needs. Field Crop Abstracts 32(1), 1-10, 32(2), 73-85.